Ethiopia’s tax-to-GDP ratio has consistently declined during the past decade, according to a new report (PDF) by Ethiopia’s Ministry of Finance (MoF) and the UK’s Institute for Fiscal Studies (IFS). Key factors contributing to the decline include structural macroeconomic shifts; tax non-compliance in wholesale, retail, and construction sectors; the proliferation of armed conflict; and an overestimation of GDP.
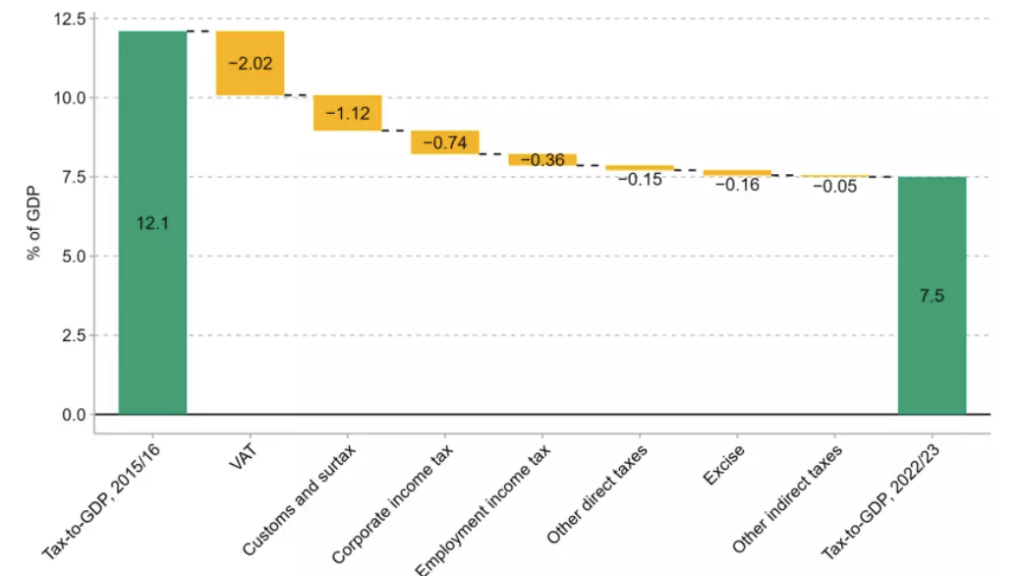
According to the report, Ethiopia’s tax-to-GDP ratio of 7.5% in 2022/23 is down from a peak of 12.4% in 2014/15. Put differently, the amount the government collected in taxes declined from 12.4 Birr out of every 100 Birr in 2014/15 to 7.5 Birr out of every 100 Birr in 2022/23. During this period, the nearly 5% decline in tax-to-GDP ratio in Ethiopia is the largest in the world. No other country in the world has experienced such a large relative decline in its tax-to-GDP ratio over this period.
Comparatively, the median tax-to-GDP ratio of sub-Saharan African countries was 13.2% (in 2021), while the average was 15.6%. For example, Uganda’s tax-to-GDP ratio was 13.1%, Kenya’s was 15.2% and Rwanda’s was 15.7%.
Figure 1: Decline in Tax-to-GDP ratio by Tax Instrument (Ethiopia)
Factors Explaining Ethiopia’s Declining Tax-to-GDP Ratio
The study, which covers the period from 2015/16 to 2022/23 due to data availability, finds that Ethiopia’s tax-to-GDP ratio has fallen by 4.6% between 2015/16 and 2022/23 (Figure 1). Of this:
- Approximately 2.2% of the decline is attributed to changes in the structure of the Ethiopian economy since 2015/16, the most important being the fall in public sector investment, which declined from 37% in 2015/16 to 22% in 2022/23—leading to a reduction in VAT collected from public sector spending. The other related shifts in the Ethiopian economy include the fall in imports as a share of GDP from 24% to 10%—leading to a decline in customs duty and surtax as a share of GDP. And the decline in manufacturing from 5.7% to 4.5% of GDP and the growth in agriculture from 35% to 36% of GDP—a shift in the composition of GDP from high-to-low tax compliance sectors.
- Around 1.8% of the decline in tax-to-GDP ratio is attributed to a reduction in compliance that cannot be explained by changes in the structure of Ethiopia’s economy. Specifically, 1.4% is a result of an increase in VAT non-compliance, particularly from the wholesale/retail sector. An additional 0.4% is a result of corporate income tax underperformance or non-compliance, particularly from wholesale and construction sectors.
- Very little can be attributed to policy changes, as there have been very few revenue-losing reforms since 2015/16.
- In sum, of the 4.6% decline in Ethiopia’s tax-to-GDP ratio, 4% can be attributed to structural economic factors and VAT non-compliance from wholesale, retail, and construction sectors.
The Impact of Conflict on GDP and Tax Revenue
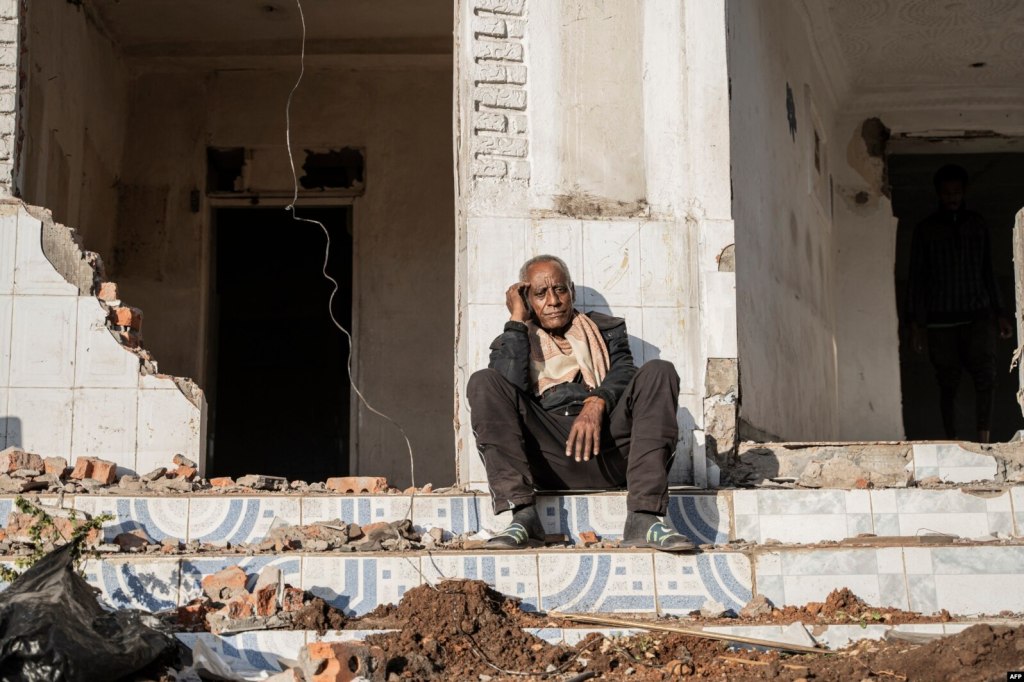
An important yet underestimated factor impacting Ethiopia’s declining tax-to-GDP ratio are the ongoing conflicts throughout the country. In particular, armed conflict has decimated the economy of northern Ethiopia (Amhara, Afar, and Tigray), where post-conflict reconstruction from the two year civil war (2020-22) will cost an estimated $30 billion. Researchers from Oxford University estimate that by 2027, the Ethiopian economy will be 19% smaller than if pre-conflict trends had continued (Oxford Initiative on Peace and Recovery in Ethiopia, 2022).
While underscoring the longstanding adverse effects that the two-year civil war will have on Ethiopia’s economy, both the report by MoF/IFS and Oxford University do not take into account the ongoing conflict in the Amhara region, which began in 2023, and where economic activity, including agriculture and industry has been severely impacted. Since May 2023, war has raged in Ethiopia’s Amhara region where economic activity, including agriculture and industry have largely ground to a halt.
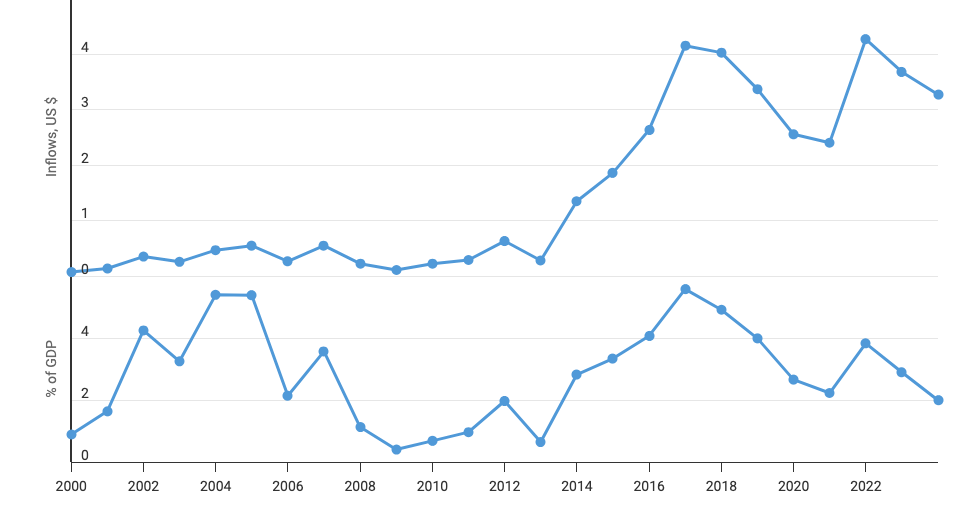
In addition, due to widespread insecurity and lawlessness throughout the country, logistics and transportation have been severely limited, including the movement of people, goods, and services. Furthermore, the proliferation of armed conflict and Ethiopia’s removal from the African Growth and Opportunities Act has led multinational companies to the retreat from the Ethiopian market, leading to a significant decline in foreign direct investment (FDI). For example, FDI declined from nearly 6% of GDP in 2016/17 to 3% of GDP in 2021/22, and dropped to 2% of GDP in 2024 (Figure 2).
Figure 2: Foreign Direct Investment, Net Inflows (US$ Billions and % of GDP) (2000-23)
Undoubtedly, these various elements related to conflict in Ethiopia are adversely effecting fiscal policy and GDP writ large. While the MoF/IFS report acknowledges that conflict has likely impacted the tax-to-GDP ratio, it does not, however, comprehensively estimate the extent to which the numerous conflicts in Ethiopia have contributed to a decline in GDP, the composition of GDP, and ultimately, the decline in tax-to-GDP ratio.
Economic Mismanagement, Overestimation of GDP, and Inadequate Institutional Capacity
Economic Mismanagment
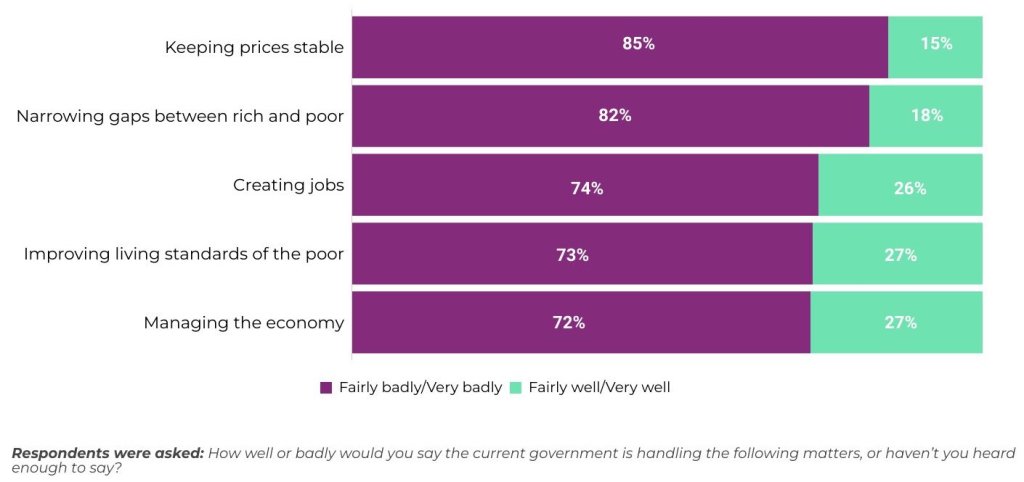
Another contributing factor to the declining tax-to-GDP ratio—linked to the structural economic shifts discussed above—is economic mismanagement (Figure 3). Specifically, economic mismanagement as it pertains to: i) insufficient investments in revenue generating, jobs creating, and tax complying sectors, including manufacturing and industry; ii) the lack of quality and reliable economic statistics and national accounts; and iii) inadequate institutional capacity to ensure tax compliance.
Figure 3: Evaluation of Government Economic Performance in Ethiopia (2023)
First, the report finds that the composition of GDP has shifted over the past decade—with the growth of agriculture from 35% to 36% of GDP, and the decline of manufacturing from 5.7% to 4.5% of GDP. The composition of GDP should be changing in the opposite direction, with the manufacturing sector—critical for job creation, income and revenue generation, and structural economic transformation—growing as a percentage of GDP, rather than the agricultural sector.
The fact that manufacturing’s share of GDP is declining in Ethiopia, which had a nascent yet robust and growing manufacturing sector (PDF) in 2015/16, is indicative of economic misprioritization and mismanagement. As the MoF/IFS report notes, in addition to the myriad economic advantages of a robust manufacturing sector, the manufacturing sector is more tax compliant compared to the agricultural sector; which, in Ethiopia, is composed of small-scale shareholders engaged in subsistence farming.
Overestimation of GDP
Second, a critically important factor contributing to the declining tax-to-GDP ratio could be the lack of quality and reliable economic statistics and national accounts. Specifically, the overestimation of GDP figures in recent years. If GDP figures are inflated (denominator), the tax figures will naturally decline (numerator). In other words, overestimated GDP figures could be leading to Ethiopia’s declining tax-to-GDP ratio. The report notes that “GDP (growth) may simply have been inaccurately measured,” due to Ethiopia’s complex economy, dominated by agriculture and a large informal sector, making accurate measurement difficult. The report also notes that “there may have been political pressure to make statistical choices that boosted measured GDP, or outright data manipulation.”
The researchers attempt to assess the accuracy of GDP estimates by using three alternative measures of economic activity: i) earnings growth from the Urban Employment Unemployment Survey (UEUS); ii) growth in night lights as measured by a satellite; and iii) aggregate consumption growth from the Ethiopia Socioeconomic Survey (ESS). While UEUS and night light measures of economic activity find significant overestimation in official GDP figures, particularly beginning in 2017/18, the ESS measure tends to be more consistent with the official accounts.
Over the past several years, reports have increasingly highlighted that the Abiy Ahmed regime exaggerates, if not fabricates, economic statistics; particularly, GDP, GDP growth rate, per capital GDP, inflation, and agricultural production data. Consequently, the lack of quality and reliable economic statistics led to the World Bank designating Ethiopia’s economy as “unclassified” in its most recent country income classifications report.
Lack of Institutional Capacity
Third, the lack of institutional capacity could be contributing to the declining tax-to-GDP ratio. According to the report, tax administration capacity in Ethiopia is lower than other SSA countries. In addition, ad-hoc tax exemptions may be more prevalent in Ethiopia than in other countries, while tax policies such as low minimum capital requirements for corporate income tax holidays, low withholding rates and a large number of tax treaties may be reducing the tax-to-GDP ratio.
Conclusion
In conclusion, the new report on Ethiopia’s tax-to-GDP ratio illustrates the dire state of fiscal policy in Ethiopia. The report highlights structural macroeconomic shifts, tax non-compliance, conflict, and overestimated GDP figures as key factors contributing to a declining tax-to-GDP ratio. Going forward, the report suggests that sustainable growth in the tax-to-GDP ratio will require reversing the decline in tax compliance and boosting tax revenue collected domestically and from the private sector.
This new report comes at a time when the Abiy Ahmed regime, as a component of an IMF structural adjustment programme, is implementing massive tax hikes in Ethiopia. At the same time, poverty is increasing throughout the country, while austerity measures undermine health and education programs and the social safety net.